Be yourself; Everyone else is already taken.
— Oscar Wilde.
This is the first post on my new blog. I’m just getting this new blog going, so stay tuned for more. Subscribe below to get notified when I post new updates.
Be yourself; Everyone else is already taken.
— Oscar Wilde.
This is the first post on my new blog. I’m just getting this new blog going, so stay tuned for more. Subscribe below to get notified when I post new updates.
Here in this report analysis, we will be talking about contemporary macroeconomic issue and providing the original analytical essay for the same. So as for this report we will be briefly analyzing the impact of liberalization towards the contribution to GDP and what policy changes were involved during liberation and then there is a detailed study regarding the change in employment pre liberalization and post liberalization and then according to the detailed study there is acritical analysis regarding the causes for such changes.
Here in this report analysis, we will be talking about contemporary macroeconomic issue and providing the original analytical essay for the same. So as for this report we will be briefly analyzing the impact of liberalization towards the contribution to GDP and what policy changes were involved during liberation and then there is a detailed study regarding the change in employment pre liberalization and post liberalization and then according to the detailed study there is acritical analysis regarding the causes for such changes.
Liberalization is the policy in which the government regulations are relaxed and there is a reduction in state involvement. Liberalization is even associated with privatization and it leads to economic liberty through reduction in tax restrictions. Liberalization has direct impact on economic growth, which implies the increase in the Gross Domestic Product through technological innovations, increase in labor productivity and employment etc.
So, in this analysis we will talk about the components of GDP post and pre 1991.Before 1991 the economic growth was mostly affected by agriculturtural shocks and thus at that point of time it justified the sunspot theory by HC Moree, who said that only crop failures lead to economic depression. Now we have data table which estimates changes in total output over the period of time.
Click to access DatabookDec2014%202.pdf
Analysing the table in the link above looking at the variable Share to total GDP at current prices , it shows that till 1970s agriculture accounted for 40% of the total output and thus the fluctuations were primarily driven by monsoon shocks. The reason for this agricultural monopoly were many and some of them will be discussed here .There were restrictive economic policy and tariff barriers and to explain the credibility of these restrictions we have one such example where during 1990-1991 the tariffs on imports were as high as 87% and there were no access to advanced technologies and better raw materials. Another reason adding to the monopoly was restrictive foreign direst investment till 1991 as there were huge restriction on royalty payments and technical fees .Another important reason is lack of the contribution of private sector and it was because there were no private investments because large industries has to seek permission under monopolies and restrictive trade practices act and there were price and distribution controls applied to steal ,petroleum and pharmaceuticals industry. For the next part of the analysis, the data base shows increased contribution of industry towards total GDP and fluctuation in economic growth due to investment fluctuations. These investment driven fluctuations were due to many revisions in policies such as there were reduction in peak import duties and policies to improve the foreign direct and portfolio investment such as up to 51% foreign equity was allowed under the number of sectors. Foreign portfolio investment were allowed up to 24% of the total equity of any company. There were abolition of industrial licensing and the new industrial policy of 1991 stressed on greater role of private sector by reducing reservations for public sector. An important step was taken towards the liberalisation of interest rates because pre 1991 the Statuary liquidity ratio (SLR) rates were as high as 40% so it was proposed that bank should be given freedom to determine interest rates and thus after 1991 the SLR rates were reduced which moved the economy towards market-based determination of interest rates.
Graph 1:

Graph:2

Thus, since 1991 India witnessed increase of private investment as apart of GDP. The figure shows the time series of private corporate gross fixed capital formation (GFCF). In the mid-1990s, private corporate GFCF rose from 5% of GDP in 1991-92 to 9% of GDP. The second figure shows that the public sector capital formation (investment) as a percent to GDP. It was the dominant source of investment in the pre nineties period.
Now we will see that how these factors affect employment and then we will analyse the employment trends post and pre liberalisation period.
The employment elasticity for manufacturing sector increased from 0.26 in the pre reform period to 0.33 in post economic period. The employment elasticity increased in the export-oriented industries, whereas there was a fall in employment elasticity from 0.425 to 0.264 in the import-oriented industry. The industries with positive net exports are known as export oriented industry whereas the industries with negative net exports are known as import oriented industry. Thus, it was found that export intensified industry has positive impact on employment. The employment level in the organized manufacturing sector increased at an annual rate of 1.5 percent while the employment increased at an annual rate of 3.82 percent in the unorganized sector.
The employment growth in the pre liberalisation period is lower than that of post liberalization period. Employment level in the agricultural sector suffered the most in the post liberalisation period because the employment growth declined from 1.41% to .71 %. Whereas in the secondary sector the employment level registered the growth of 4.18% which is a very significant growth. Liberalisation policies had a positive impact on the employment of secondary sector. The liberalisation policies targeted manufacturing sector because it believed that when the economy will open up it will lead to higher output due to better allocation of resources and increase in trade will increase the employment and production.

The table right above shows that the growth in the partial liberalisation period from 1985 to 1990 was quite higher than pre liberalisation period. Many industries registered a considerable growth in employment. During early 1980’s the manufacturing sector showed a negative growth of -.07%. After the post reform period employment raised significantly in all industries especially apparel industry and furniture registered the growth of 17.9 percent and 10.8 percent respectively. The total employment in manufacturing industry had a decent growth of 3.51% against the 2.20% and – .07% in period of 1980’s .Although the growth didn’t continued for long because there is a massive decline in the employment growth of 18 organized manufacturing in the second half of liberalization period and thus the period of 1997 to 2004 registered the negative growth of -1.03% and -.99%.
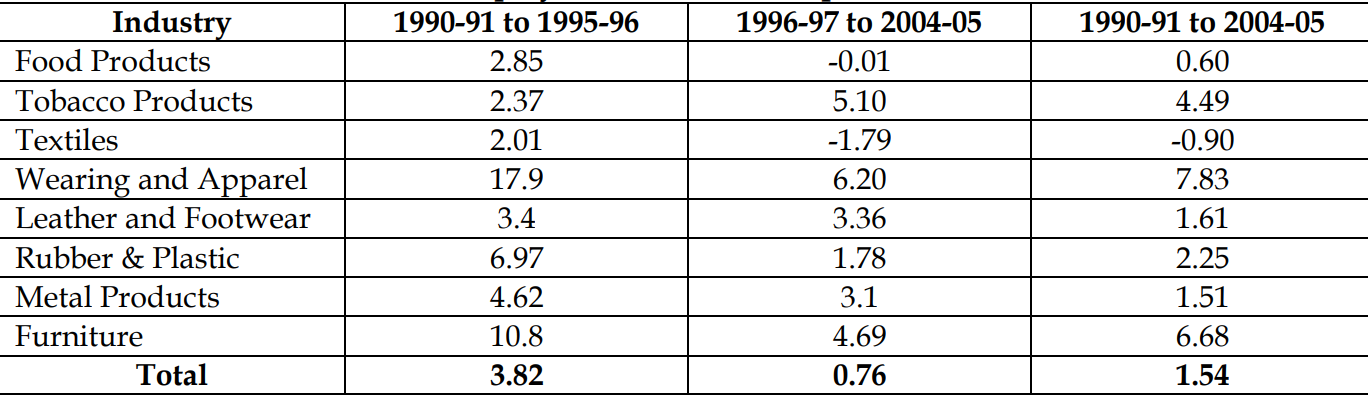
This table shows that export-oriented industries had high employment during 1990 to 1996, especially the apparel with (17.8%) and furniture with (10.8%). So, with the database of the first sub period of post reform liberalisation had positive impact on employment. But after 1996 there is a drastic deceleration in most of the industries because the overall growth declined from 3.82% to 0.76% during 1996-2005.But overall if we see there is positive growth of 1.54%.
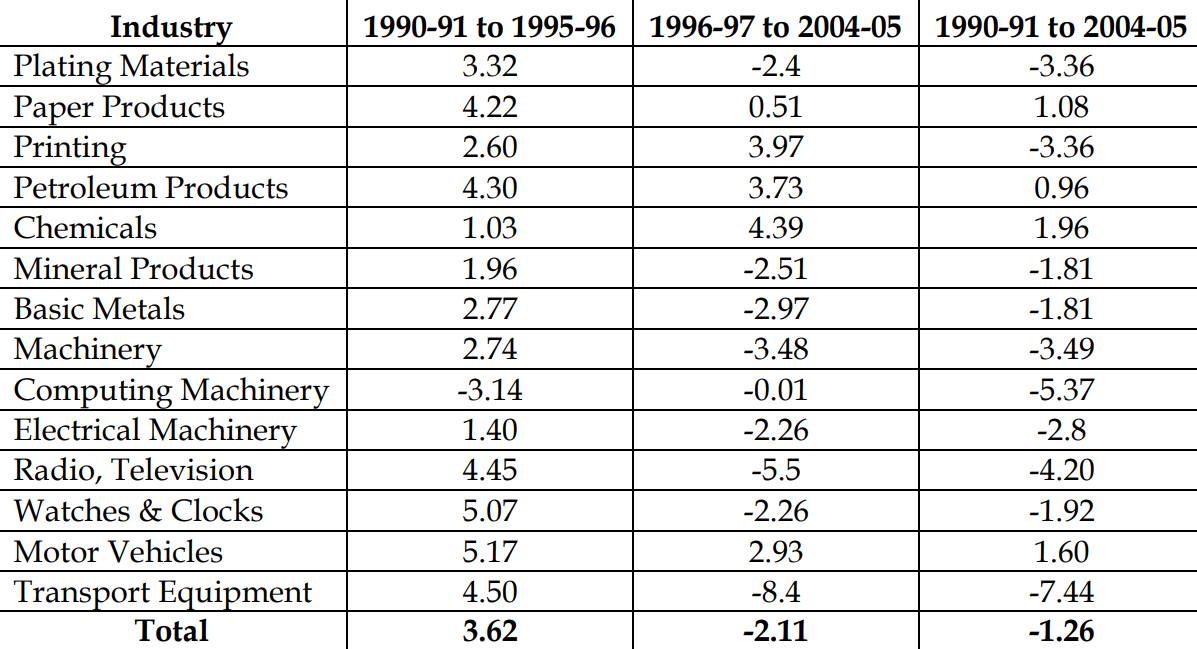
The above data table shows for the import competing industries that the employment growth in first phase of liberalisation is more than pre liberalisation period. But the second phase led to the negative economic growth. And for import competing industries it is observed that growth in employment in pre liberalisation period is more than post liberalisation period because there is an overall negative growth of -1.26%.
Now we will see why there was deceleration in the employment growth in the second phase of the liberalization period. According to the observation this deceleration was due to reduction in output and exports. Growth in output decreased from 8.65% (1990-1996) to 1.01% (1996-2005). The exports declined from 13.95% to 7.73% in the second phase .And even the import increased from 13.95% to 15.49% in the second phase which can also be identified as the cause for fall in employment. Thus, what we can infer is that the industries with high employment have high exports and output. Now it’s the time for the critical analysis of all issues discussed above.
During liberalization an import liberalization policy such as abolition of supplementary licences for all importers except small-scale industries, enhancement of Import Replenishment (REP) license entitlements to 30 percent etc were taken up to internationalize the production process. During this process the domestic industries relied on imported raw materials. Import liberalization in India was implemented with two specific objectives that is to increase the export competitiveness and to expose domestic producers to external competition. During liberalization there was a devaluation of 21% in rupee which was a great incentive for export competing industries. Thus, as we observed from earlier instances and data tables that the export competing industries did really well, it’s because trade openness offers the opportunity to domestic firms to enter the foreign market, which increase exports and employment in these industries, there is a proper mechanism behind it and is that during restrictive trade regimes there were no improvement in the quality of exports but with access to cost saving technology and raw materials the export competitiveness has increased which has led to the positive impact on export competing industries. But as we can observe with above tables it is opposite for import competing industries and even with export-oriented industries with import liberalization the employment grew but in the second half it drastically fell because of some important reasons. Import liberalization can lead to some negative impacts also, increase in import liberalization can lead to huge leakage in the economy because there will be sudden increase of imported goods in final consumption and even in production process as the imported goods serve as inputs. As we saw earlier import competing industries registered low growth than export competing industries because in the case of import liberalisation the import competing domestic producers are forced to cut down their production and thus the GDP will also reduce. It will have a very adverse impact on employment of domestic producers. Due to this there is regional disparities in wages and employment because the labour market adjusts according to the trade and thus move from import competing industries to export firms and it is even great to all those regions where the production depends upon import competing industries. Due to import liberalization the market share of domestic firms decreases because they can’t cope up with the foreign competition and thus ultimately it leads to falling productivity and reduction in the domestic sector employment. The growing internationalization even led to decline in wages of the low skilled workers and has widened the wage inequality between the skilled and unskilled workers. Liberalization also lead to disparities because, by producing innovative products industrialized counties will take away the demand of traditional goods produced in developing economies. As a result, both production and employment in developing countries will decline, exactly what happened in India in the second phase of post reform period. The decline in employment is also because liberalization was taken up when there was high inflation in the economy which would have ultimately reduced the real wages of the workers which reduces labour supply and leads to unemployment. During Liberalization industries shifted from labour intensive technologies to capital intensive technologies because labour intensive could not adapt to the changes in market structure and which led to unemployment among local workers. So, hereby we conclude with the detailed effects of liberalization on employment and thus it has been a very informative one and very learning project .
REFERENCES
Ray, A. (1993). External Sector Liberalisation in India. Economic and Political Weekly, 28(40), 2161-2166. Retrieved from http://www.jstor.org/stable/4400231
Chandrasekhar, C., & Parthapratim Pal. (2006). Financial Liberalisation in India: An Assessment of Its Nature and Outcomes. Economic and Political Weekly, 41(11), 975-988. Retrieved from http://www.jstor.org/stable/4417962
Prasad, P. (1997). Liberalisation: In Theory and in Practice. Economic and Political Weekly, 32(13), 645-646. Retrieved from http://www.jstor.org/stable/4405228
Ray, A. (1987). Economic Liberalisation in India: Balance of Payments Implications. Economic and Political Weekly, 22(28), 1141-1148. Retrieved from http://www.jstor.org/stable/4377218
This is an example post, originally published as part of Blogging University. Enroll in one of our ten programs, and start your blog right.
You’re going to publish a post today. Don’t worry about how your blog looks. Don’t worry if you haven’t given it a name yet, or you’re feeling overwhelmed. Just click the “New Post” button, and tell us why you’re here.
Why do this?
The post can be short or long, a personal intro to your life or a bloggy mission statement, a manifesto for the future or a simple outline of your the types of things you hope to publish.
To help you get started, here are a few questions:
You’re not locked into any of this; one of the wonderful things about blogs is how they constantly evolve as we learn, grow, and interact with one another — but it’s good to know where and why you started, and articulating your goals may just give you a few other post ideas.
Can’t think how to get started? Just write the first thing that pops into your head. Anne Lamott, author of a book on writing we love, says that you need to give yourself permission to write a “crappy first draft”. Anne makes a great point — just start writing, and worry about editing it later.
When you’re ready to publish, give your post three to five tags that describe your blog’s focus — writing, photography, fiction, parenting, food, cars, movies, sports, whatever. These tags will help others who care about your topics find you in the Reader. Make sure one of the tags is “zerotohero,” so other new bloggers can find you, too.
